Last Tuesday (September 13, 2016), at the School of Sciences and Engineering (FCE) – UNESP, Tupã, the CoDAF Project offered another workshop. This time, the focus was on the use of visualization models, such as charts and graphs, for data interpretation. Taught by collaborators M.S. Fábio Mosso Moreira and Leonardo Felipe Franchi, the workshop presented alternatives that can provide data visualization by means of spreadsheets and network graphs. During the workshop, aspects related to the use, operation and feasibility of data visualization applications in professionals' daily work were discussed.
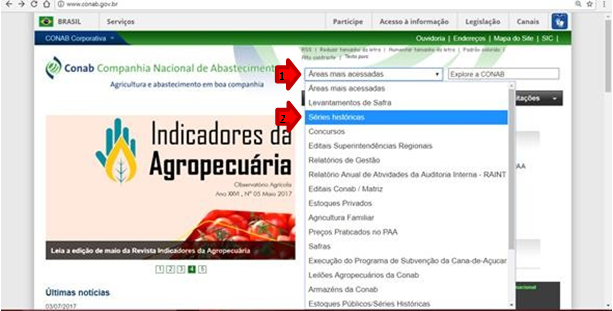
“It was possible to observe positive feedback from the participants when they came across the features provided by electronic spreadsheets, such as building charts that allow data to be viewed in a clear and objective way,” said Moreira, who was in charge of the workshop.
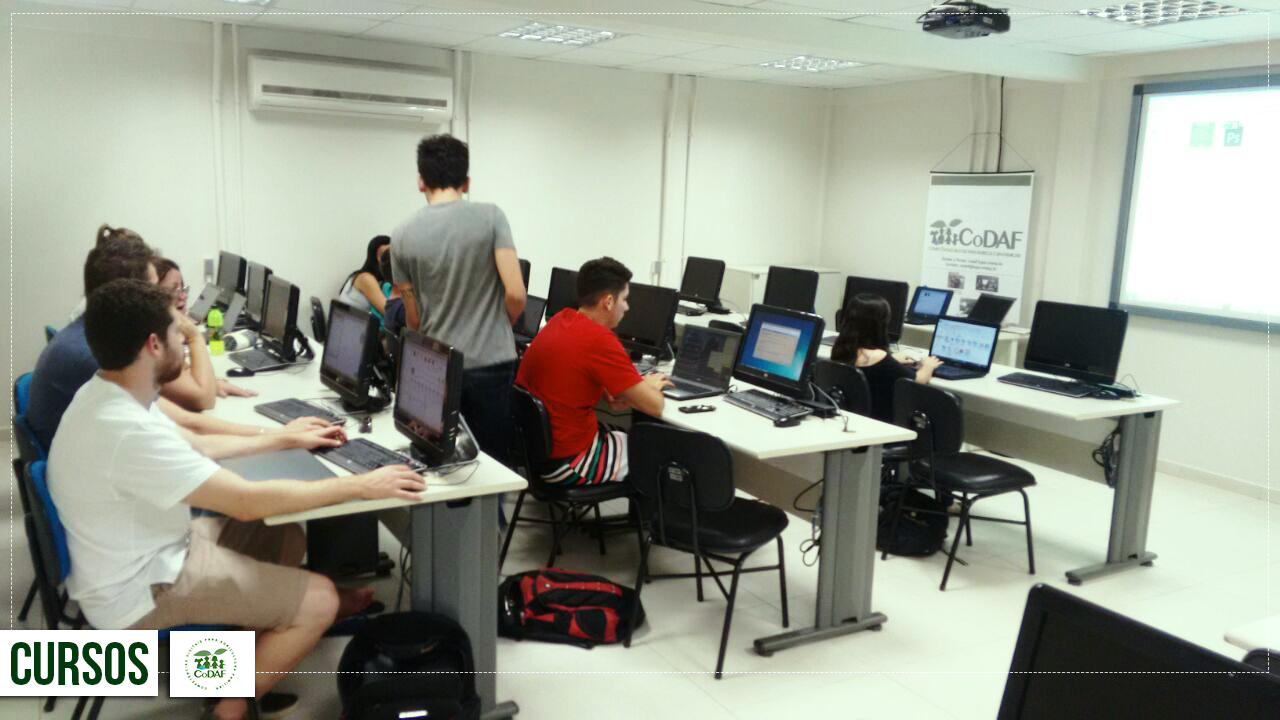
CoDAF holds weekly meetings in which reflections are raised on the use of information and communication technology in rural areas. At these events, completely free workshops open to the public are offered. Those interested in the subject only need to get in touch at codaf@tupa.unesp.br. The events take place at the School of Sciences and Engineering (FCE) – UNESP, Tupã.
Reviewed by Elaine Parra AffonsoPublished by Leonardo Felipe Franchi
The accuracy of the information on this page, as well as of the images and photographs, is the sole responsibility of the cited sources and does not necessarily reflect the opinion or position of the Digital Skills for Family Farming (CoDAF) outreach project, its collaborators or the institutions linked to the project.