The Brazilian Institute of Geography and Statistics (IBGE) generates statistics classified into two groups, namely, the Social, Demographic and Economic Information group and the Geographic Information group.
The Social, Demographic and Economic Information group contains the following categories:
- Social and Demographic Statistics
- Agriculture and Livestock Statistics
- Economic Statistics
- Price Indexes
- National Accounts System
Information related to agricultural and livestock production is found in three of the categories: Agriculture and Livestock Statistics, Economic Statistics and National Accounts System.
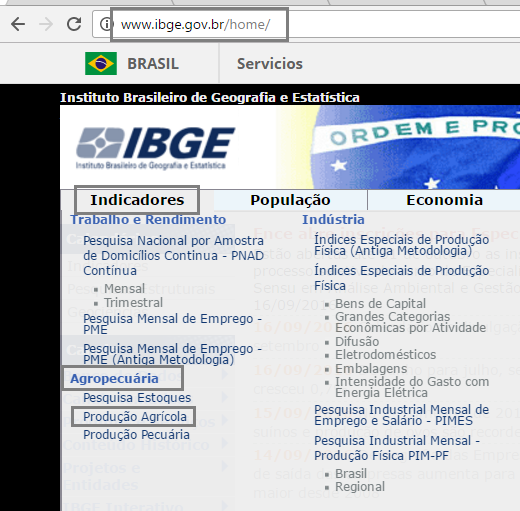
The statistical report called Systematic Survey of Agricultural Production has data on production using various organization criteria, such as cultivated areas, productive areas, food groups, and comparative data between periods, both monthly and annual. To find this survey, within the IBGE website (http://www.ibge.gov.br), one can follow these menu options: Indicators, Agriculture and Livestock and finally click on Agricultural Production. Figure 1 indicates the tabs that must be clicked.
FIGURE 1: Navigation options to find the Data Source
In the left results section there are three options for generating the reports:
- Tables
- IBGE Indicators Publication (in pdf format)
- Complete publication (in pdf format)
In this research, the Tables description was chosen, which generates data to be viewed directly on the website, without offering the reader the possibility of downloading them.
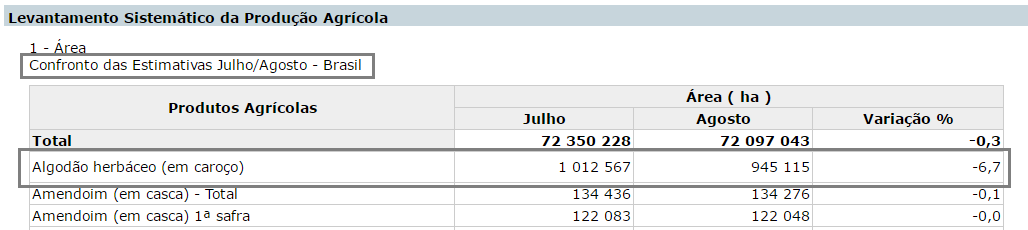
One of the options is Comparison of Estimates July/August 2016 –Brazil, where the report labeled Areas has estimates by cultivated areas in hectares (ha). One can observe each agricultural product with the area cultivated in both July and August, and the percentage variation in the area of each product. For example, Herbaceous cotton (seed cotton) had 1,012,567 ha cultivated in July 2016, and 945,115 ha cultivated in August 2016. The data indicate a variation of -6.7 % (negative variation) for this product (value obtained by comparing the production of these months). Figure 2 illustrates the presentation of the data.
FIGURE 2: Model of data presentation
Description of the options available within the Tables menu
| Comparison of Estimates July/August 2016 – Brazil | |
| Area | Each product with the area cultivated in hectares per month, and the percentage of variation in each. |
| Production | Each product with total production expressed in tons (t) per month, and the percentage of variation in production. |
| Average Yield | Each product with the average yield, expressed in kilograms (kg) per hectare (ha) per month, and the percentage of variation in yield. |
| Comparison of the 2015 and 2016 Harvests – Brazil | |
| Area | For each product, the area harvested in the 2015 harvest and the area to be harvested in the 2016 harvest, expressed in hectares (ha), and the percentage of variation for each |
| Production | For each product, the production in tons (t) harvested in the 2015 harvest, the amount expected in the 2016 harvest, and the percentage of variation for each |
| Average Yield | For each product, the yield in kilograms (kg) per hectare (ha) in the harvest gathered in 2015, the yield expected in the 2016 harvest, and the percentage of variation for each |
| Production of cereals, legumes and oilseeds | For each product, the production in tons (t) harvested in the 2015 harvest, the amount expected in the 2016 harvest, and the percentage of variation for each, only for cereals, legumes and oilseeds. |
In all the reports in this category, except for the production of cereals, legumes and oilseeds, the products presented are:
| Herbaceous cotton (seed cotton) | Barley (grain) |
| Peanut (in shell) - Total | Beans (grain) - Total |
| Peanut (in shell) 1st harvest | Beans (grain) 1st harvest |
| Peanut (in shell) 2nd harvest | Beans (grain) 2nd harvest |
| Rice (paddy) | Beans (grain) 3rd harvest |
| Oats (grain) | Orange |
| Potato - Total | Castor bean |
| Potato 1st harvest | Cassava |
| Potato 2nd harvest | Corn (grain) - Total |
| Potato 3rd harvest | Corn (grain) 1st harvest |
| Cocoa (bean) | Corn (grain) 2nd harvest |
| Coffee (grain) - Total | Soybean (grain) |
| Coffee (grain) - arabica | Sorghum (grain) |
| Coffee (grain) - canephora | Wheat (grain) |
| Sugarcane | Triticale (grain) |
| Onion |
The products present in the reports on the production of cereals, legumes and oilseeds are:
| Herbaceous cotton (seed) | Rye (grain) |
| Peanut (in shell) 1st harvest | Barley (grain) |
| Rice (paddy) | Beans (grain) 2nd harvest |
| Beans (grain) 1st harvest | Beans (grain) 3rd harvest |
| Castor bean (berry) | Sunflower (grain) |
| Corn (grain) 1st harvest | Corn (grain) 2nd harvest |
| Soybean (grain) | Sorghum (grain) |
| Peanut (in shell) 2nd harvest | Wheat (grain) |
| Oats (grain) | Triticale (grain) |
All the data contained in this option can be downloaded as a pdf file with the options IBGE Indicators Publication and Complete publication.
Consult the data source by clicking here.
The accuracy of the information on this page, as well as of the images and photographs, is the sole responsibility of the cited sources and does not necessarily reflect the opinion or position of the Digital Skills for Family Farming (CoDAF) outreach project, its collaborators or the institutions linked to the project.