Wheat is a commodity used in food products (pasta, flour, cookies, breads, sweets, etc.), in non-food products (adhesive and printing mixtures, glues, alcohol, antibiotics, etc.) and also in animal feed (hay, grain or in feed composition). In addition, production in Brazil is highly relevant, so much so that it encouraged the group to analyze data on productivity/planted area and also to compare the years 2012 to 2016, showing a forecast for the year 2017.
Information about the data source
The data used in the work were taken from the website of CONAB (National Supply Company), which works in the field of studies and statistics on agricultural product prices (production cost, planting expectations, grain harvest, volume and location of stocks). It is a public company linked to the Ministry of Agriculture, Livestock and Supply, whose aim is to contribute to the decisions of those responsible for the links in the chain: in the areas of production, storage and distribution. It provides data on: harvests; family farming; CONAB warehouses; prices charged in the PAA (Food Acquisition Program); annual reports of internal audits and on management; regional trend notices and also about the CONAB headquarters; private and public stocks and historical series; monthly and weekly market overviews; agricultural auctions; publications, among others.
Source name: Historical series of the wheat harvest
Maintaining institution: National Supply Company (Conab): Agriculture and supply in good company
Address to access the source: http://www.conab.gov.br/index.php
Description of the navigation process to the data source
Step One: Go to the CONAB website hyperlink shown above, then follow the orange rectangles highlighted in the figure below, which are: Products and Services, Harvests and Historical Series.

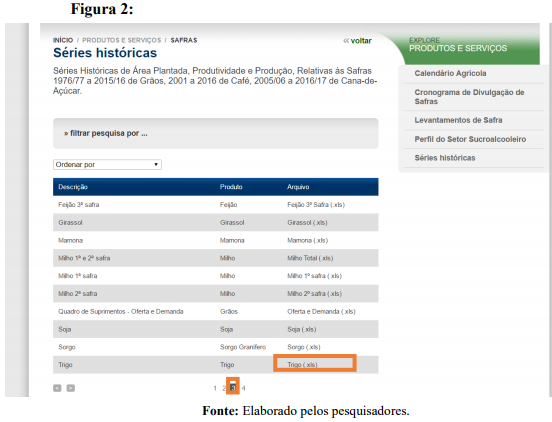
Step Two: The “historical series” item will lead to a second page, as Figure 2 below shows. There, you select number 3, highlighted by the orange box, which will present the chosen file, wheat. So, to find the database you must click on the name “wheat” that the orange rectangle in the figure below is showing.
Information about the data
The file format accessible at the data source is .xls.
In the first tab, there is a table of the historical series of planted area in thousand hectares, for wheat, in the 2000 to 2016 harvests. The first column gives the Region/State, such as: North, Northeast, Central-West, Southeast, South, North/Northeast, Center-South, Brazil. The other columns are the 2000 to 2016 harvests with their respective values.
In the second tab, there is a table related to the historical series of production (wheat) in thousand tons. The first column holds the Region/State, namely North, Northeast, Central-West, Southeast, South, North/Northeast, Center-South, Brazil. The following columns give the harvests from 2000 to 2016, with their respective values.
In the third tab, there is a table of the historical series of productivity in kg/ha, where in the first column we have the Region/State (North, Northeast, Central-West, Southeast, South, North/Northeast, Center-South, Brazil) and then the columns for the 2000 to 2016 harvests along with their values.
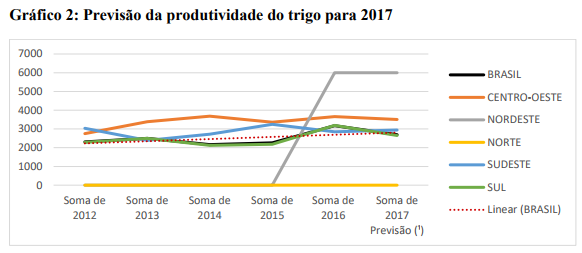
In the fourth tab, the trend for 2017 was found. And for better visualization, a pivot table was developed, containing: Region/State in the Columns field, the Sum of the harvest values from 2012 to 2017 in the Rows field, and then the grand total. Thus, using this table, a line chart (because it is a historical series) was built with the data obtained. In the chart, it is possible to see the difference in each year, and the dotted line is the 2017 trend.
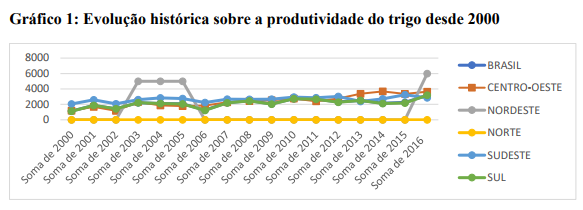
In the fifth tab, a pivot table was obtained containing the following information: the columns hold the data for Brazil, Center-South, Northeast, North, Southeast and South, and the rows hold the sum for each year, from 2000 to 2016. From this, a chart was built for a temporal analysis of productivity, with the Regions/States in the legend and the sum of the values for each year on the axis.
Data visualization
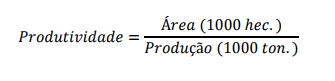
To describe the information, graphical visualizations were generated for the chosen data. The chart below shows a historical evolution of wheat productivity, represented by the formula below.
References:
AMORIM, D. Northeast overtakes Southeast in grain production for the 1st time, 2015. Available at:. Accessed Jul. 3, 2017.
BRUM, A. L.; MULLER, P. K. The reality of the wheat chain in Brazil: the producers/cooperatives link, 2008. Available at: < http://www.scielo.br/pdf/resr/v46n1/a07v46n1.pdf > Accessed Jul. 3, 2017.
CANZIANI, J. R.; GUIMARÃES, V. D. A. Wheat in Brazil and in the world: production, processing and marketing chain. In: CUNHA, G. R. da (Ed.). Workshop on wheat in Brazil: foundations for building a new Brazilian wheat farming. Passo Fundo: Embrapa Wheat, 2009. pp. 29-72.
COÊLHO, J. D.; XIMENES, L. J. F. Grain production in the Northeast: with an eye on China. ETENE, 2, 27-39, Oct. 2016.
Authors: Adônis Barbosa Carreira*; Ana Carolina Nascimento Nóbrega*; Mariana Oliveira Furlan*; Patrícia Hoshijima*; Sabarrah Maria Jorge*.
* Students in the Business Administration program at São Paulo State University - "Júlio de Mesquita Filho".
The accuracy of the information on this page, as well as of the images and photographs, is the sole responsibility of the cited sources and does not necessarily reflect the opinion or position of the Digital Skills for Family Farming (CoDAF) outreach project, its collaborators or the institutions linked to the project.