This data source representation provides data on rainfall indices for the Tupã region, collected from the portal of UDOP - Bioenergy Producers Union.
Information about the origin of the data
UDOP – Bioenergy Producers Union – was founded in 1985 by the directors of the autonomous distilleries created under the National Alcohol Program (ProÁlcool), with the aim of enabling the exchange of information among these directors, as well as training professionals for the units and fostering the exchange of knowledge and information through the meetings of the technical committees established. Its aims are to facilitate technical and professional development for the main agents of the bioenergy sector; to serve its member companies in their technical and administrative interests, as well as all others related to bioenergy sector activities; to facilitate the dissemination of journalistic information, as well as to provide consulting on internal and external communication to its members; and to collaborate with public authorities on economic and social development.
Source name: Rainfall Indices
Maintaining institution: UDOP - Bioenergy Producers Union
Access address: https://www.udop.com.br/index.php?item=chuvas
To get to the data source, go to the home page of the UDOP website (https://www.udop.com.br/index.php); click on “Services”, then click on the 6th item called “rainfall indices”, and scroll down until you find the desired city.
Information about the data
The available indices can be queried and viewed in monthly and annual intervals; the results are displayed on the page itself in PHP format. The files containing the databases can also be downloaded in the “Portable Document Format (PDF)” format.
About the data attributes:
Year: Refers to the base year of the rainfall index measurement
January – December: There are twelve columns referring to the reference month attribute of the rainfall index measurement
Total: The total sum of the monthly rainfall index amounts.
Data visualization
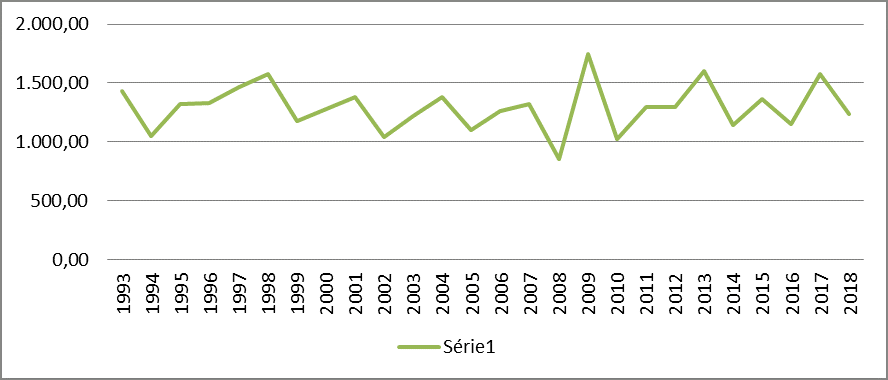
The chart shows the Total Value of the rainfall level in millimeters per year, collected by UDOP in the city of Tupã, starting in 1993.
AUTHOR: Adonis Barbosa Carreira
The accuracy of the information on this page, as well as of the images and photographs, is the sole responsibility of the cited sources and does not necessarily reflect the opinion or position of the Digital Skills for Family Farming (CoDAF) outreach project, its collaborators or the institutions linked to the project.