The Institute of Agricultural Economics – IEA is a component of the São Paulo Agribusiness Technology Agency – APTA, a body linked to the Secretariat of Agriculture and Supply of the State of São Paulo. IEA was one of the first institutions to take up studies on agricultural economics in Brazil, carrying out research and analyses, and disseminating knowledge and information about agriculture to society.
IEA conducts statistical studies of prices, production area, forest markets, wages, among others, carried out in partnership with the Integral Technical Assistance Coordinating Office (CATI), constituted as sources for public and private management. The collection of statistical data can contribute to institutions, wholesalers, retailers and producers.
Information about the Origin of the Data
IEA provides a database containing data on agriculture.
| Portal | INSTITUTE OF AGRICULTURAL ECONOMICS – SP |
| Source | Database |
| Link | http://www.iea.sp.gov.br/out/bancodedados.html |
The data available on the portal that were used to develop the visualizations were
Title: “Average monthly prices received by Farmers”
Source: http://ciagri.iea.sp.gov.br/nia1/precos_medios.aspx?cod_sis=2
Parameters:
- Product: Table oranges
- Period: JAN/2011 to JAN/2016
After the query is run, the data can be downloaded as a file in CSV (comma-separated) format, which can be manipulated by spreadsheet software such as Microsoft Excel or LibreOffice Calc.
Information about the data
The data for the query “Average Monthly Prices Received by farmers” have the following attributes:
| Product | Refers to the type of crop of the Average Monthly Prices Received by Farmers. |
| Month | Refers to the monthly period researched, to analyze variation within this period. |
| Year | Refers to the annual period researched, to analyze variation within this period. |
| Currency | Refers to the currency studied in relation to prices. |
| Price | Refers to the prices recorded within the months. |
| Unit | Refers to the product's unit of weight (kg, pe, box, t, among others). |
Data visualization
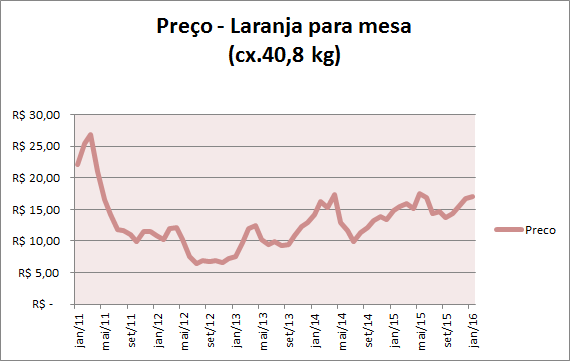
To demonstrate possible visualizations generated from the analysis of the data from the query “Average Monthly Prices Received by Farmers”, the following visualization was generated:
Chart 1 - represents the prices of table oranges, with weight measured per 40.8 kg box, where the vertical axis (price) shows the variation in the average monthly prices received by farmers, and the horizontal axis the period from Jan/2011 to Jan/2016.
Other authors: Thais F. Modeneis
Reviewed by Fabio Mosso Moreira
The accuracy of the information on this page, as well as of the images and photographs, is the sole responsibility of the cited sources and does not necessarily reflect the opinion or position of the Digital Skills for Family Farming (CoDAF) outreach project, its collaborators or the institutions linked to the project.